
Eighty percent of global trade moves by sea. In 2025, 137 incidents of piracy and armed robbery were recorded worldwide - a five-year high - while war-risk insurance premiums in the world’s most critical shipping corridors rose as much as 60-fold above their pre-crisis baselines. This report examines three chokepoints - the Bab el-Mandeb / Horn of Africa, the Strait of Malacca and Singapore, and the Gulf of Guinea - through two lenses: the standard regional threat assessments used by maritime security agencies, and the Moral Disorder Index (MDI), which scores 195 countries across seven dimensions of institutional and moral disorder. The comparison reveals a consistent pattern: MDI corridor scores predict the type, severity, and trajectory of illicit maritime activity with greater precision than incident counts alone.

THE MDI FRAMEWORK: WHY DISORDER DRIVES RISK
The Moral Disorder Index measures institutional and structural disorder across 195 countries and seven dimensions: Truth (press freedom, information integrity), Authority (rule of law, governance legitimacy), Body (violence, exploitation), Family (social cohesion), Sovereignty (territorial control, border integrity), Sacred (religious freedom), and Creation (property rights, environmental governance). Scores run from 0 to 100; higher scores indicate greater disorder. Countries are assigned to six bands: Low, Concerning, Elevated, High, Critical, and Severe (unseenfront.com/moral-disorder-index).
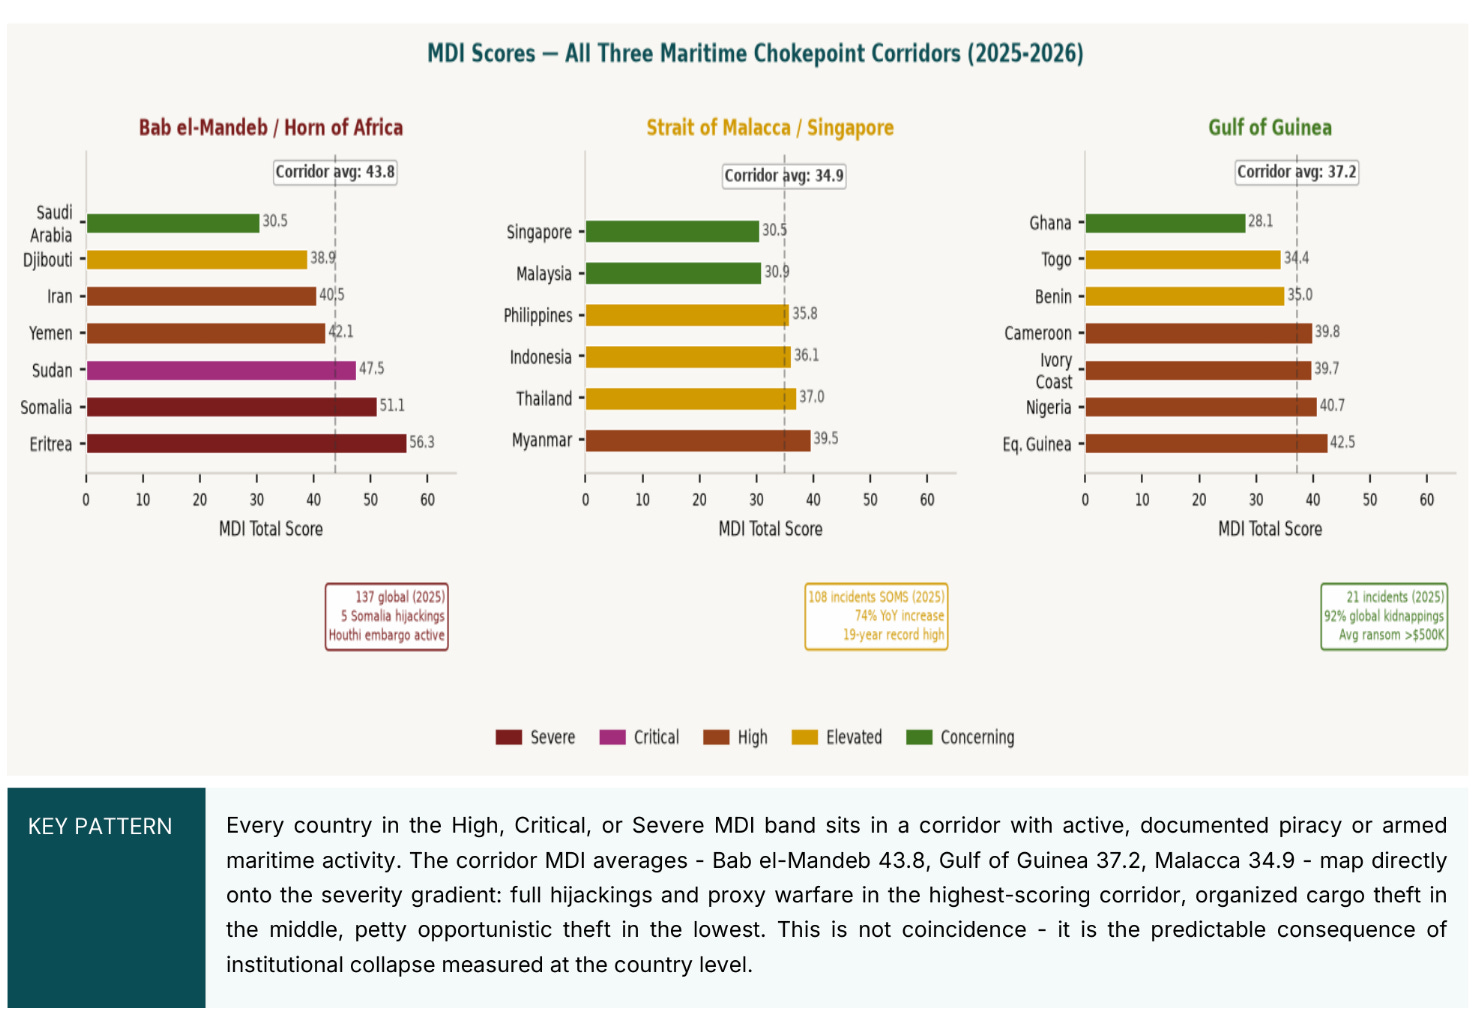
For maritime risk analysis, two MDI dimensions carry particular predictive weight. The Authority dimension tracks the breakdown of legitimate governance and rule of law - the structural condition that enables criminal networks to operate without accountability. The Sovereignty dimension tracks the state’s ability to control its territory and waters. When both are elevated simultaneously, as they are in Somalia (Authority 78.7, Sovereignty 24.5) and Yemen (Authority 81.4, Sovereignty 27.4), the result is a maritime environment where piracy and illicit activity face no credible deterrent. The Creation dimension, which covers property rights and rule of law over physical resources, also matters: Yemen scores 5.6 and Somalia 26.8 - among the lowest in the entire 195-country dataset.
MDI SCORES ACROSS ALL THREE CORRIDORS
CORRIDOR ANALYSIS
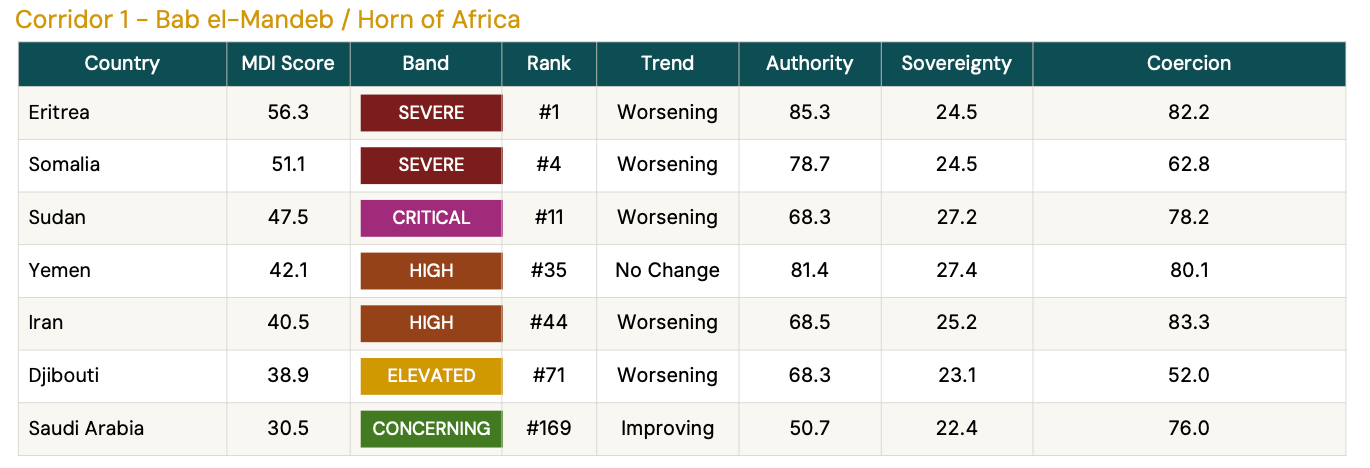
This corridor carries the most severe MDI profile of any major shipping zone worldwide. Six of seven corridor states score elevated or higher; five are Worsening. In July 2026, the Houthis declared a maritime embargo against Saudi Arabia, prompting war-risk premiums to rise from approximately 0.3% to 0.75% of hull value within 48 hours (Saul, Reuters, 20 July 2026). Fully closing the strait would reduce global oil supply by an estimated 7% (Reuters). Simultaneously, Somali piracy resurged: four vessels were seized in under two weeks in April-May 2026, including the Emirati-linked oil tanker Eureka, for which a $10 million ransom was demanded (Madey, The Hill, August 2026). A 2025 UN Panel of Experts report documented direct meetings between Yemen-based networks and Somali militant groups, resulting in weapons and GPS targeting equipment flowing across the Gulf of Aden (Madey 2026). The MDI correctly predicted this: Yemen’s Authority score of 81.4 and Somalia’s Severe-band ranking reflect exactly the conditions - legitimacy collapse and coercive governance - that make the corridor a production site for proxy warfare and criminal piracy simultaneously.
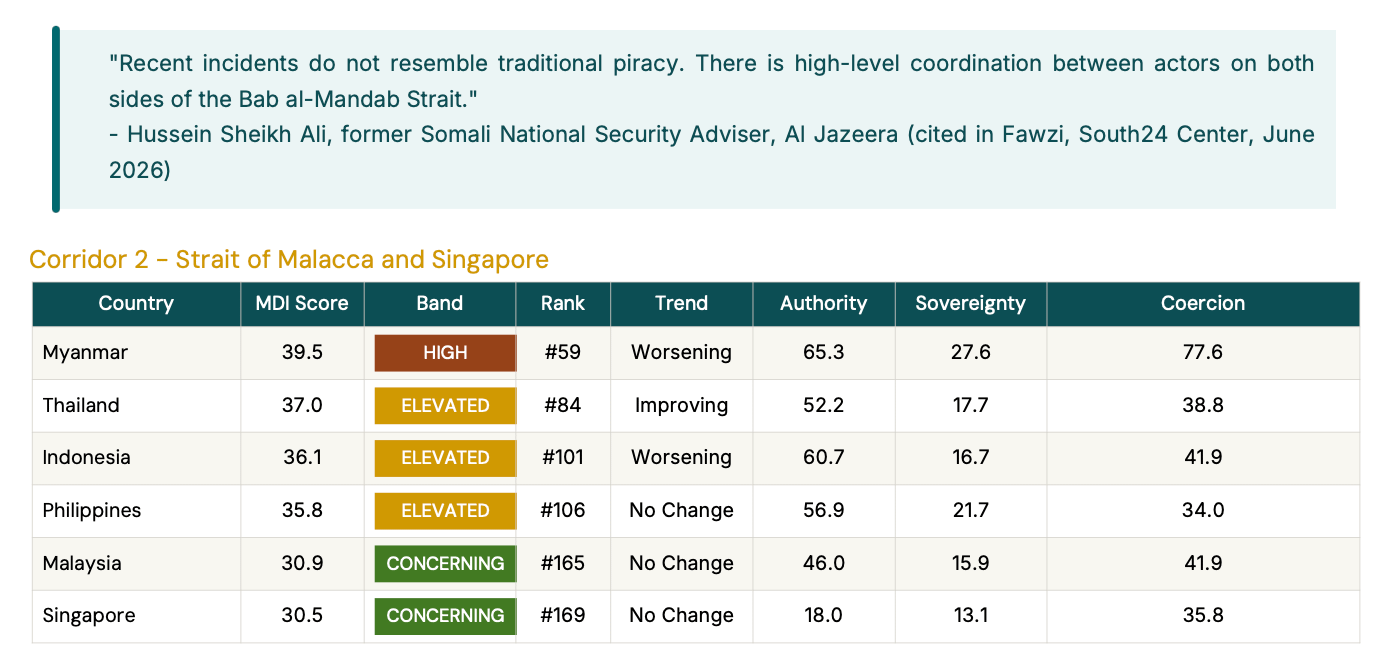
The Strait of Malacca and Singapore (SOMS) carries approximately 60% of global trade by volume (CNA, January 2026) and is the primary transit route for semiconductor inputs, electronics, and East Asian energy imports. In 2025, ReCAAP recorded 108 incidents in the SOMS - a 74% year-on-year increase and the highest figure since 2007 (ReCAAP Annual Report 2025). Bulk carriers accounted for 52% of targeted vessels; 87% of incidents occurred in the first seven months of 2025 before arrests by Indonesian authorities disrupted the networks in July-August. The MDI profile explains the character of this activity: corridor states average 34.9 - meaningfully lower than Bab el-Mandeb - and no state scores in the Critical or Severe band. The result is high-frequency, low-severity crime (engine spare theft, opportunistic boarding at night) rather than hostage-taking or weaponized embargo. Myanmar is the notable outlier at MDI 39.5 (High, Worsening, Authority 65.3, Coercion 77.6) and represents the primary corridor deterioration risk if junta control extends into Andaman Sea and Malacca approaches.
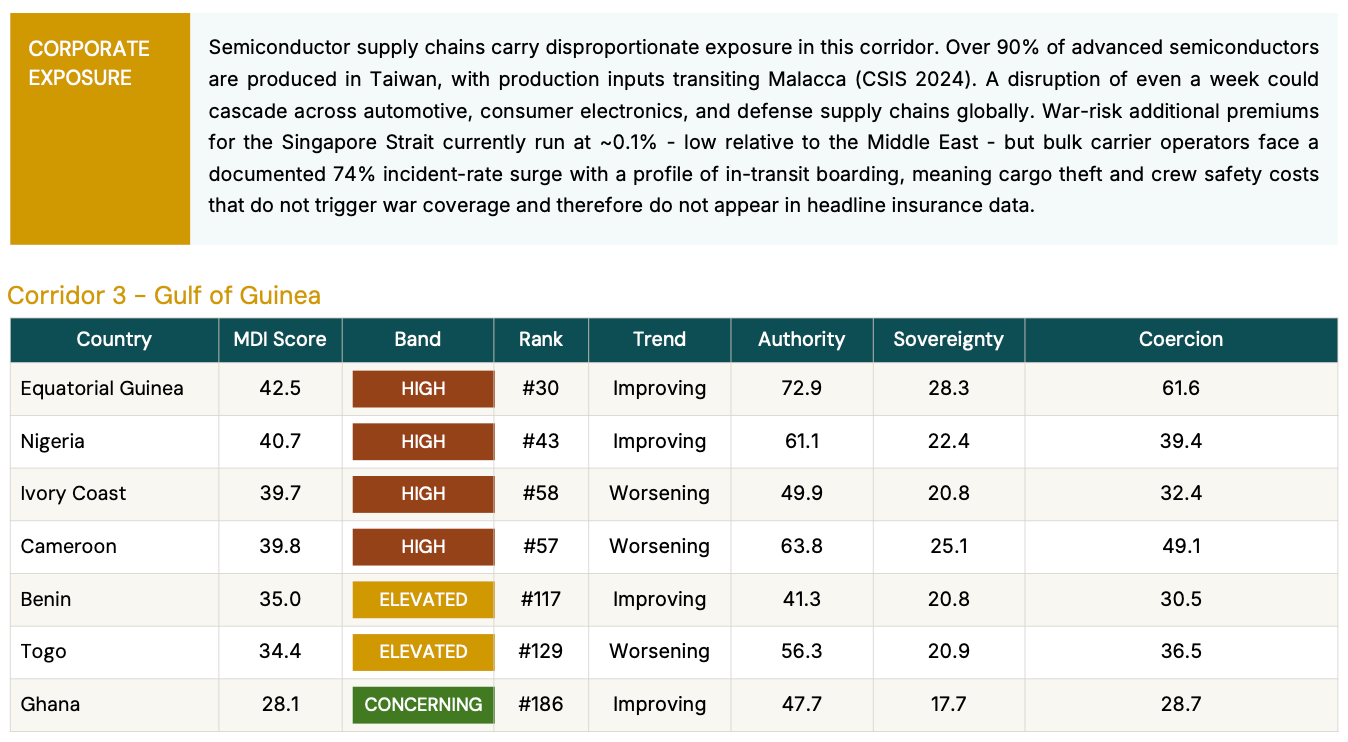
The Gulf of Guinea carries the most dangerous profile for crew. In 2025, 21 incidents were recorded - a seemingly modest figure - but they accounted for 92% of all crew kidnappings globally, with 23 seafarers abducted, up from 12 in 2024 (ITF / IMB Annual Report 2026). Average ransom demands exceed $500,000 per hostage (Turqoa 2026). Kidnap-for-ransom operations targeting senior Western crew members are well-organized and frequently executed by Nigerian Delta networks (USDOT Maritime Advisory 2026-009). The corridor MDI average of 37.2, with five of seven states in the High or above band, produces a specific threat profile: organized criminal networks with state indifference, operating in waters where coastal authority is nominal. Three states - Ivory Coast, Cameroon, and Togo - are worsening, meaning the MDI trajectory points toward increased disorder in the precise coastal zones where piracy operates. The relative improvement in headline incident counts is partly attributable to Nigeria’s Deep Blue program and increased naval patrols, but the IMB acknowledges significant underreporting, with actual incidents estimated at two to three times official figures (Turqoa 2026).
INSURANCE RISK: THE FINANCIAL ARCHITECTURE OF MARITIME DISORDER
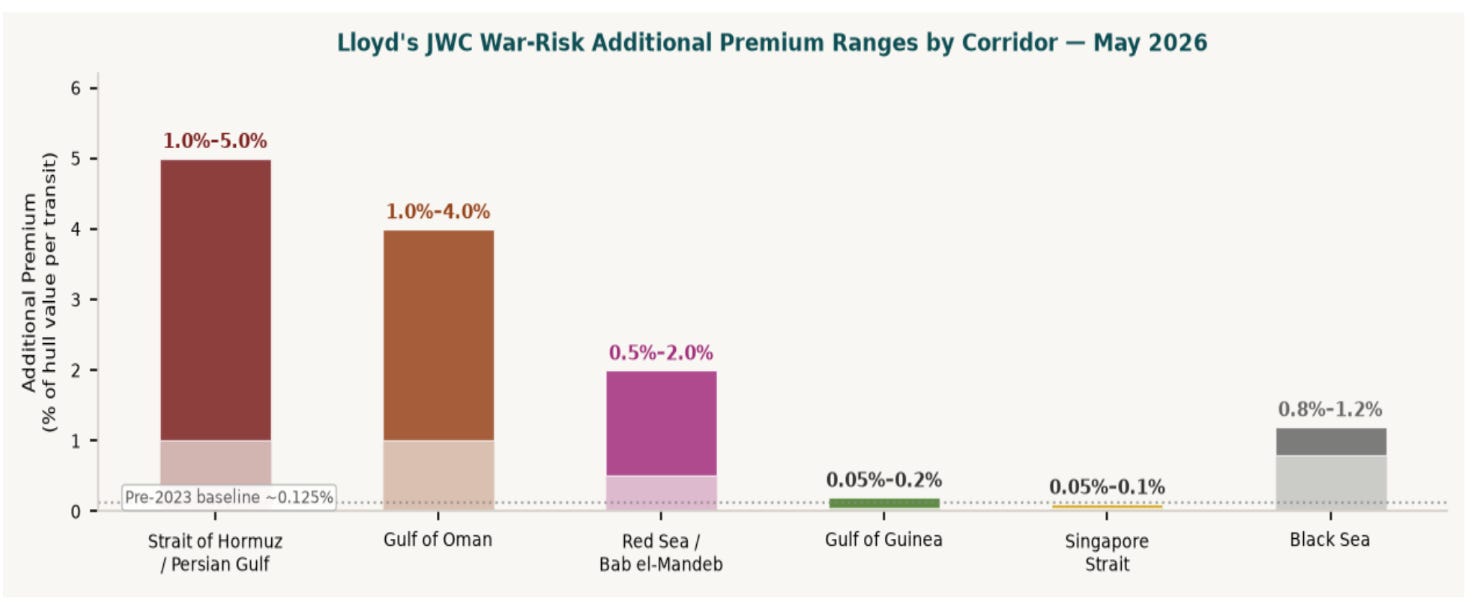
The Lloyd’s Joint War Committee (JWC) - the body that sets listed areas triggering war-risk coverage clauses in hull insurance - is effectively a real-time institutional assessment of MDI-type conditions. When it listed the southern Red Sea and Bab el-Mandeb in December 2023, standard annual policies were suspended for those waters and premiums repriced on a voyage-specific basis (CIMSEC, June 2026). The mechanism creates direct corporate cost at the transaction level: a $100 million hull that previously paid ~$125,000 per annum in war-risk coverage now pays $500,000 to $1,000,000 per Red Sea transit (CIMSEC 2026). At peak Hormuz exposure in March 2026, some VLCCs paid $7.5 million per single voyage - equivalent to 15-20 years of pre-crisis coverage (Eastern Herald, July 2026). Energy and oil tankers bear the largest share: they commanded 42.5% of total war-risk gross written premiums in 2025, estimated at $3.6 billion (Research Intelo 2026).

INCIDENT TRENDS AND TRAJECTORY
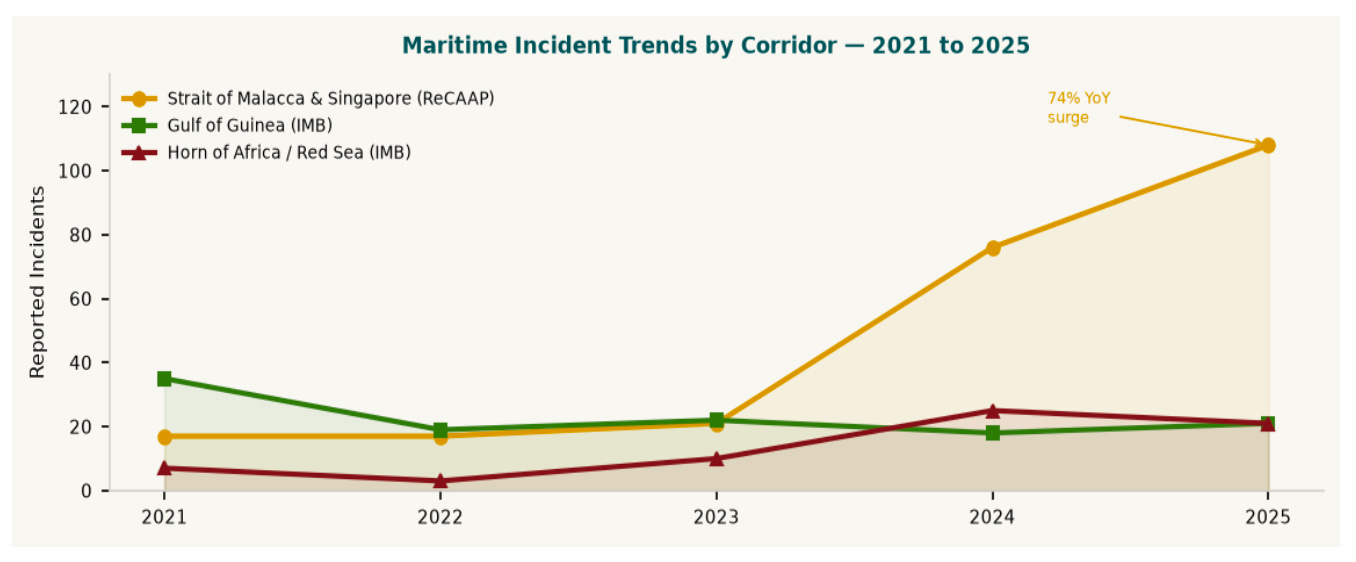
The incident trend chart illustrates a structural divergence between corridors that MDI scores anticipated. The Malacca-Singapore surge in 2025 (108 incidents, up from 13 the prior year in the Singapore Strait alone) followed a multi-year period in which Indonesia’s MDI Worsening trend - particularly its Authority dimension rising from 55 to 60.7 - signaled weakening coastal enforcement capacity. The subsequent arrests in July-August 2025 produced a sharp second-half decline, consistent with the MDI hypothesis that enforcement capacity, not structural disorder, is the primary short-term determinant of incident rates in mid-disorder corridors. In the Horn of Africa, the 2025 resurgence follows a decade-long pattern in which international naval attention, rather than MDI improvement, suppressed piracy. When that attention was diverted to Houthi missile defense, the structural MDI conditions that had been present all along reasserted themselves immediately.
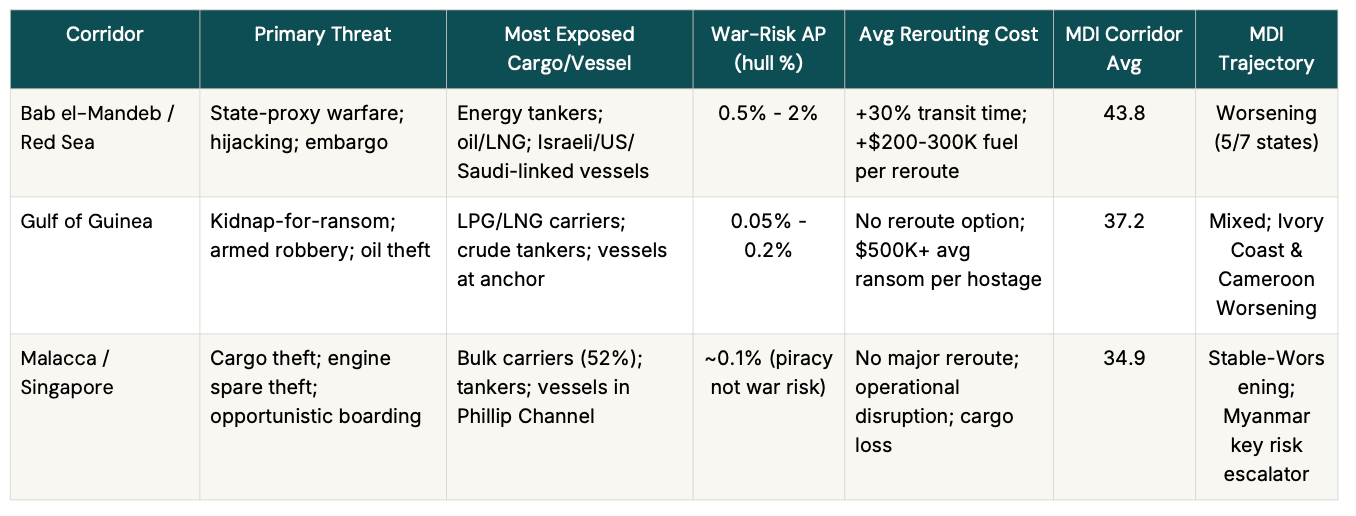
CORPORATE RISK MATRIX: WHAT OPERATORS FACE BY CARGO AND CORRIDOR
MDI AS A LEADING INDICATOR: WHAT THE DATA PREDICTS NEXT
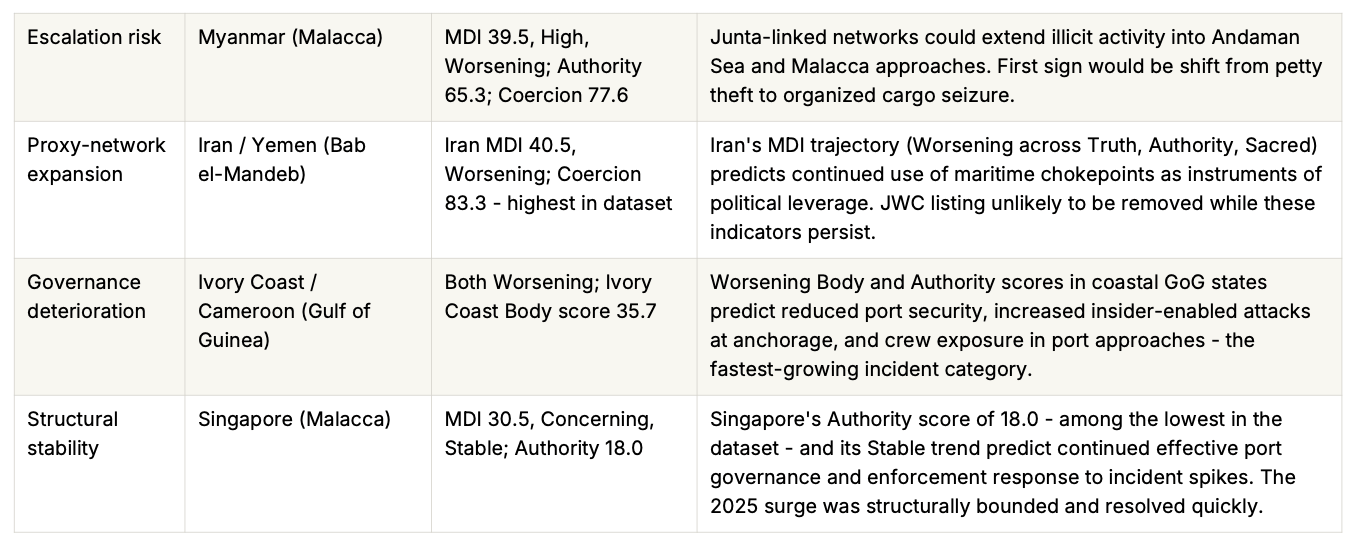
Standard maritime risk assessments - the IMB annual report, ReCAAP weekly advisories, BIMCO’s MISTO, U.S. MARAD advisories - are incident-driven. They tell operators where attacks occurred last month. The MDI measures the structural conditions that produce attacks before they happen. Three signals in the current dataset carry forward-looking significance for companies operating in these corridors.

Sources
Author / SourceReferenceKey Data Used
BIMCO / ICS / INTERTANKO et al. (March 2025) maritimeglobalsecurity.org BMP MS; MISTO threat overview covering all five corridors
CIMSEC (June 24, 2026) cimsec.org/the-insurance-chokepoint-war-risk-pricing-as-an-instrument-of-maritime-coercion/ JWC listing mechanics; $500K–$1M per Red Sea transit on $100M hull; 60%+ Suez Canal drop
CSIS (April 2024) csis.org/analysis/state-maritime-supply-chain-threats Semiconductor supply-chain exposure; Malacca as primary production-input transit route
Eastern Herald (July 2, 2026) easternherald.com/2026/07/02/hormuz-war-risk-insurance-lloyds-ceasefire-premiums-2026/ $7.5M per Hormuz voyage on $150M VLCC; 1% post-ceasefire rate (10x pre-crisis baseline)
Fairway ETA (May 6, 2026) fairwayeta.com/insights/war-risk-insurance-2026-hidden-cost-shipping War-risk AP table by corridor May 2026; Singapore Strait ~0.1%; Gulf of Guinea 0.05–0.2%
Fawzi, M. — South24 Center (June 14, 2026) south24.net/news/newse.php?nid=5540 Piracy resurgence; Houthi–Al-Shabaab coordination; former Somali NSA assessment
IMB / ICC-CCS Annual Report (January 2026) icc-ccs.org / Japan P&I Club: piclub.or.jp/en/news/43408 137 global incidents 2025; 95 East/SE Asia; 21 Gulf of Guinea; 5 Somalia/Africa. Crew data.
Israr & Ghani (2025) doi:10.58622/vnr7ef13 50% Suez Canal transit decline; threefold shipping rate increase from Houthi campaign 2023–2025
Madey, S. — The Hill (August 1, 2026) thehill.com/opinion/international/6002688-tehran-maritime-terror-strategy/ Tehran maritime strategy; Yemen–Somalia pipeline; piracy 5-year high; $7B 2011 peak cost
ReCAAP ISC Annual Report (January 9, 2026) recaap.org/resources/ck/files/reports/annual/ReCAAP%20ISC%20Annual%20Report%202025.pdf 132 incidents Asia 2025 (+23% YoY); 108 in SOMS (74% increase); 19-year high; severity profile
Research Intelo (2026) researchintelo.com/report/war-risk-marine-insurance-market Energy tankers 42.5% of war-risk GWP ($3.6B); Red Sea fastest-growing premium zone 33.6%
Saul, J. — Reuters (July 20, 2026) reuters.com/legal/litigation/red-sea-war-insurance-costs-rise-after-houthi-blockade-sources-say-2026-07-20/ 0.3% to 0.75% premium jump post-Houthi blockade; 7% global oil supply at risk
Turqoa Blog (April 7, 2026) blog.turqoa.com/security/gulf-of-guinea-piracy-2026 GoG 28 incidents 2025; kidnapping demand >$500K/hostage; 2–3x underreporting acknowledged by IMB
USDOT MARAD Advisory 2026-009 maritime.dot.gov/msci/2026-009-gulf-guinea-piracyarmed-robberykidnapping-ransom Active GoG KFR advisory; recent kidnappings listed through March 2026
UnseenFront — Moral Disorder Index unseenfront.com/moral-disorder-index All MDI scores, band classifications, dimensional data, coercion ratings, and trend assessments